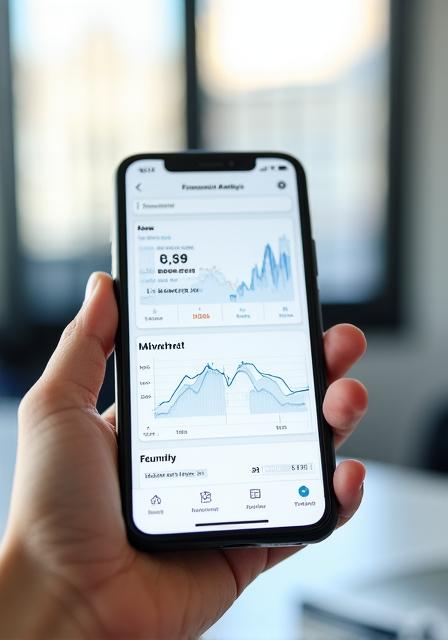
See Your Business Clearly
Transform raw data into aesthetic, actionable narratives. Our AI-driven visualization tools simplify complexity, allowing you to focus on growth.
Real-Time Updates
Experience zero-latency shifts in your data. Our dashboards sync instantly with your business sources, ensuring you never make decisions on outdated information.
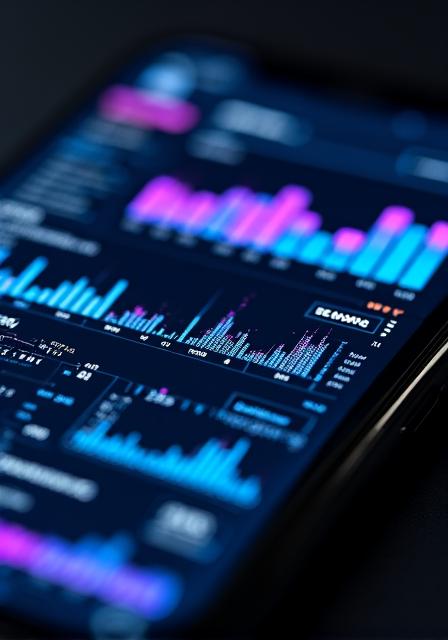
Interactive Filtering
Drill down into specifics with a single click. Every element is interactive, allowing you to filter by region, product, or timeframe without reloading.
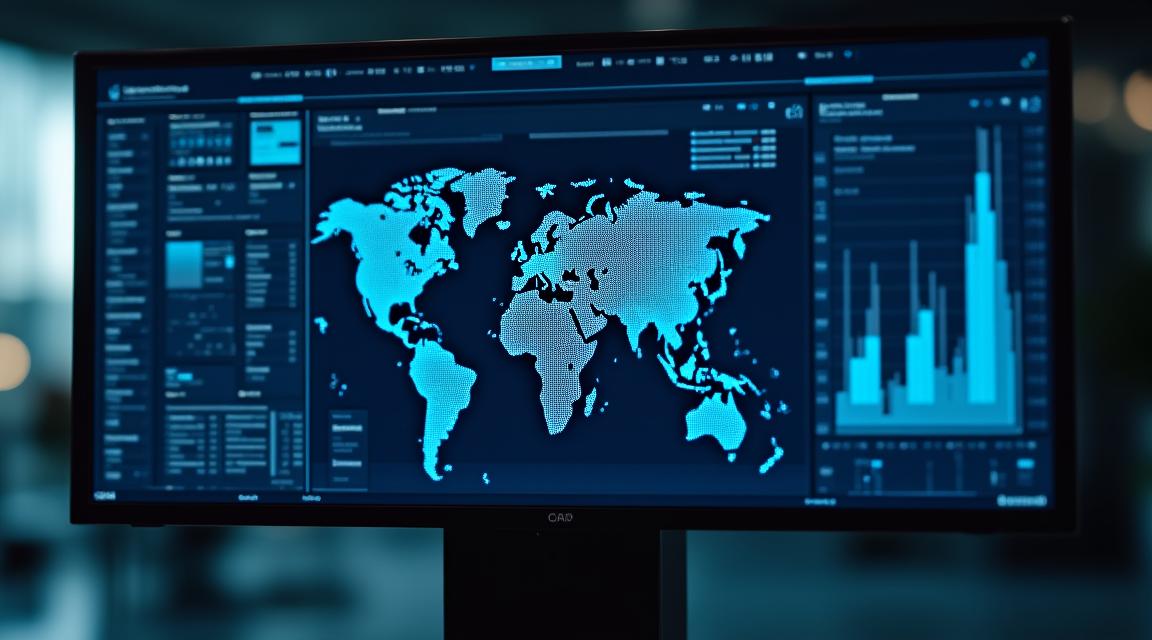
Complex Mapping
From geospatial heatmaps to intricate funnel analysis, we support over 50 visualization types designed to reveal hidden patterns in your data.
Advanced Charting Capabilities
Our platform goes beyond simple bar charts. We empower Cogito Insights clients with high-fidelity mapping and deep-layer data exploration tools.
- ✓ Heatmaps: Identify density and high-activity zones instantly.
- ✓ Scatter Plots: Fine-tune predictive models with correlative analysis.
- ✓ Geospatial Mapping: Localize your performance metrics globally.
- ✓ Funnel Analysis: Understand the customer journey and conversion leaks.
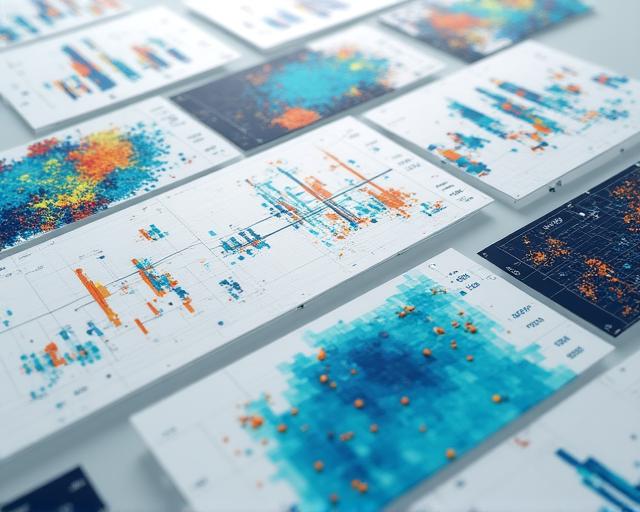
Visual Intelligence in Action